Crest Factor & Harmonic Distortion

Status
Not open for further replies.

SG-1

Senior Member
A couple of observations.
The fundamental waveform has flattened tops.
That's indicative of third harmonic content. Much single phase electronic kit produces that. Not a lot from any single item but huge numbers of them......
The notches are typical of commutation notches three phase SCR kit.


.

I think every sine wave in SC is a little flat on top. I think it is all the CFL light bulbs the co-op ( POCO) sent everybody to use !

I supected the glitches, notches, were caused by thristors. Now I have more confirmation.
 

Sahib

Senior Member
Location
India
SG-1:

I do not have a copy of the standard you mentioned.

Anyway, if you decide to go ahead with that voltage wave shape for dielectric testing, you may need to ensure that the peak to RMS value of that voltage wave is within 5% of square root of 2.
 

SG-1

Senior Member
SG-1:

I do not have a copy of the standard you mentioned.

Anyway, if you decide to go ahead with that voltage wave shape for dielectric testing, you may need to ensure that the peak to RMS value of that voltage wave is within 5% of square root of 2.

The test set has a built in analog, averaging, meter, I am looking for information to determine if it is reading high or low. If it is reading low it is probably compensating for the higher than normal crest factor. If the readings are high, then the tests are invalid.

The other variable is the crest factor reading itself. I need to verify that reading with a second meter. My sine waves at home have a flat top too but the same meter reads a 1.4 crest factor. There is the possibality the notches are causing the fluctation in the reading. I would like to see a steady number.
 

Sahib

Senior Member
Location
India
The test set has a built in analog, averaging, meter, I am looking for information to determine if it is reading high or low. If it is reading low it is probably compensating for the higher than normal crest factor. If the readings are high, then the tests are invalid.
Please explain the basis for your conclusion.
The other variable is the crest factor reading itself. I need to verify that reading with a second meter. My sine waves at home have a flat top too but the same meter reads a 1.4 crest factor. There is the possibality the notches are causing the fluctation in the reading.
For 1.4 crest factor, the test voltage is okay; but for 1.6 crest factor it is not okay.
I would like to see a steady number.
Need to shift testing location, perhaps?
 

Besoeker

Senior Member
Location
UK
I think every sine wave in SC is a little flat on top. I think it is all the CFL light bulbs the co-op ( POCO) sent everybody to use !
It's a lot of things.
I first came across this quite a few years ago. We were installing a bunch of VSDs at a pumping station station. The two largest units were, from memory, 225kW, 12-pulse units. Part of the contract was to carry out before and after harmonic surveys to ensure that the installation complied with the standard in force. The measurements were made at the point of common coupling, 11kV in this case - the primary of the transformer feeding the station.

Even without the drives running, the magnitude of the harmonics, the third in particular, quite surprised me. The site is in a residential area of a city, a city with little by way of industry. Nothing that I would have normally associated with harmonic voltage distortion.

The conclusion was that the distortion resulted from the residential load. Lots of electronic devices, none very large. Just huge numbers of them.

I've looked at my supply voltage at home and in our works. Both have the same distortion - if you do enough of it you get an eye for this without always having to do the calculations.

I supected the glitches, notches, were caused by thristors. Now I have more confirmation.
I'll send you my bill........:p
 

gar

Senior Member
Location
Ann Arbor, Michigan
Occupation
EE
130514-0825 EDT

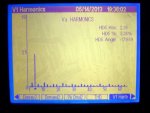
High harmonic content does not imply a high crest factor, but it may.

Consider a square wave and a modification of it. I will illustrate with 3 variations. All have high harmonic content.

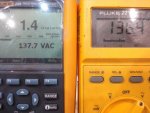
1. An exact square wave. +V volts for 1/2 period, and -V volts for the second 1/2 period. The RMS value is V, the average value is V, the reading on a Simpson 260 or Fluke 27 is V*0.707/0.636 = 1.111*V, and the crest factor is 1.0 .

2. Half of the square wave is removed. +V volts for 1/4 period, 0 for next 1/4 period, -V volts for next 1/4 period, and 0 for the last 1/4 period. By mental arithmetic the RMS value is 0.707*V, the average value is 0.5*V, Simpson 260 or Fluke 27 is 1.111*0.5*V = 0.555*V, and the crest factor for RMS is 1.0/0.707 = 1.414 . The same crest factor as a sine wave.

3. Three quarters of the square wave is removed. +V for 1/8 period, 0 for next 3/8 period, -V for 1/8 period, and 0 for the last 3/8 of the period. Again by mental arithmetic the RMS value is 0.5*V, the average value is 0.25*V, Simpson 260 or Fluke 27 is 1.111*0.25*V = 0.277*V, and the crest factor for RMS is 1.0/0.5 = 2.0 .


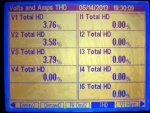
An electronic RMS measuring meter will have an amplifier or other device in the RMS conversion that will saturate or distort above some value. Call the saturation point Vs. Since many measurements are of sine waves it makes logical sense to design the meter so at full scale on a particular range that Vs is somewhat greater than 1.4 times Vrms full scale. Thus, 1.6 is probably a good choice for the meter design.

A meter of this design should read satisfactorily an RMS voltage that is 1/2 of full scale with a crest factor of 2*1.6 = 3.2 . Or if 1/4 of full scale then a crest factor of 6.4 .

A flat topped sine wave will have a crest factor somewhat less than 1.414 .

In the industrial world you will probably find virtually all commercial power sources with flat topped sine waves.

.
 

Besoeker

Senior Member
Location
UK
Earlier the blame was on usage of TV sets..............
That still is part of the problem.Televisions have become more efficient. But there are more of them. And more computers, more controlled lighting, more electronic controls in lots of things and lots more things.
 

Besoeker

Senior Member
Location
UK
A flat topped sine wave will have a crest factor somewhat less than 1.414 .

In the industrial world you will probably find virtually all commercial power sources with flat topped sine waves.

.
I think everywhere, not just the industrial.

This is my supply voltage at home:


It comes from one phase to neutral of a fairly local 11kV/400/230V 1150kVA transformer that has no industrial load on it.
 

SG-1

Senior Member
Please explain the basis for your conclusion.

For 1.4 crest factor, the test voltage is okay; but for 1.6 crest factor it is not okay.

Need to shift testing location, perhaps?


If the meter is reading less voltage than what is actually applied then the operator is going to turn the knob farther to bring the voltage on the meter to the correct level. For instance if the operator sets the voltage so the meter is reading 19KV the test set is actually applying more than that. GARs experiment seems to indicate an averaging meter will read lower & lower as the crest factor increases.

A 1.5 crest factor is also out of spec.

My next step is to verify the Fluke 289 reading by other means.
 

gar

Senior Member
Location
Ann Arbor, Michigan
Occupation
EE
130514-1413 EDT

Besoeker:

The word should have been industrialized. Even in the third world countries there is probably a flat top.


SG-1:

Yes the RMS value of a waveform relative to its peak voltage drops more slowly than an averaging meter as the crest factor increases. It is sort of intuitive, and I am not sure of an easy way to prove this for an arbitrary waveform.

A pure sine wave has a crest factor of exactly the sq-root of 2.

An experiment with two meters, an RMS Beckman and an average Fluke 27.

With my flat topped waveform vs the same source but filtered I see no significant difference between the two meters.

I suggest that you put an RMS meter in parallel with your present analog meter and see if they read differently. Note: for a flat topped sine waveform and the RMS reading is 100 V, then the peak voltage of the waveform will be somewhat less than 1.414 times the RMS value. Thus, your test waveform produces a smaller peak test voltage using your original 40 year old criteria. Is it significant? You will need to use other means to determine this.

.
 

Besoeker

Senior Member
Location
UK
130514-1413 EDT

Besoeker:

The word should have been industrialized. Even in the third world countries there is probably a flat top.

Point taken
I've been around the world a bit.
Ridden hard and put up wet as my wife might say.
The worst I saw was ina zinc plant in Turkey. The Anatolia region.
The harmonic voltage distortion had taken out all the fluorescent lighting.
 

robbietan

Senior Member
Location
Antipolo City
130514-1413 EDT

Besoeker:

The word should have been industrialized. Even in the third world countries there is probably a flat top.

.

I am in the Philippines. Tell me about it.

Once had a customer blame "flat tops" for the erratic behavior of their elevators.
 

SG-1

Senior Member
Things were nice & quiet tonight Crest Factor was 1.4

I did manage to find a meter that could measure harmonics. I have a base line for that now when the crest factor is normal.

I was surprised that the 5th harmonic was the greatest, I was really expecting the 3rd to dominate.

Here is an not so great picture of the two Flukes.
 

Attachments

  • ION 5th HARM.jpg
    ION 5th HARM.jpg
    54.6 KB · Views: 0
  • ION THD 2.jpg
    ION THD 2.jpg
    80.7 KB · Views: 0
  • Fluke Pair 1.jpg
    Fluke Pair 1.jpg
    68.9 KB · Views: 0

GoldDigger

Moderator
Staff member
Location
Placerville, CA, USA
Occupation
Retired PV System Designer
I was surprised that the 5th harmonic was the greatest, I was really expecting the 3rd to dominate.

Since you are looking at the supply voltage from the grid (yes?), it is possible that the bigger generators of third harmonics along with other higher odd harmonics (such as rectifiers and switching mode power supplies) have a third-harmonic-suppressing distribution transformer or two between them and you. That leaves the fifth harmonic, even though it may have been lower in amplitude at the source, to be dominant.

Plus what Besoeker said. :)
 
Last edited:

gar

Senior Member
Location
Ann Arbor, Michigan
Occupation
EE
130415-0841 EDT

SG-1:

To get a reasonably clean sine wave from my 60 Hz power I used 5000 ohms and 3 ufd as a filter, 3 db point 10 Hz. Then I read the Beckman RMS and Fluke 27 meters simultaneously at the filter output. The input to filter was in the 10 V range. The capacitors were polystyrene which are a very low dissipation factor device.

With a filter like this and the parallel measurement you can see if there is a calibration difference between the meters with a pure sine wave input. If the two meters are different, then the ratio of the readings can be applied to your direct line measurements to see if the difference in readings is a result of the waveform distortion, or just because of the scaling difference.

The tests with and without the filter should be run at about the same voltage. You do not need polystyrene capacitors, just good paper, Mylar, or polypropylene.

.
 

gar

Senior Member
Location
Ann Arbor, Michigan
Occupation
EE
130514-0938 EDT

If your average reading and RMS meters read the same on a pure sine wave, then on a square wave the average reading meter should read very close to 1.111 times larger than the RMS reading. The exact ratio is
(sq-root of 2/2) / (2/Pi) =
approximately
(1.414213562/2) / (2/3.141592654) =
0.707106781 / 0.636619772 =
1.110720735 .

Going from a sine wave to a square wave is a large change in waveform, but it only introduced about a 10% error between the two measurements.

On the other hand you could put a very large narrow spike at the top of a sine wave and produce very little change in either an average reading or RMS meter reading. But this could have a very profound effect on a voltage breakdown test. Really a peak reading meter as well as an average or RMS meter may be needed in such breakdown tests since input waveforms are not very clean these days.

.
 
Last edited:
Status
Not open for further replies.
Top