crossman
Senior Member
- Location
- Southeast Texas
Okay, I would really appreciate some thoughts on this... I have been spending hours thinking about this, and want to get some insight on how the rest of you would look at this.
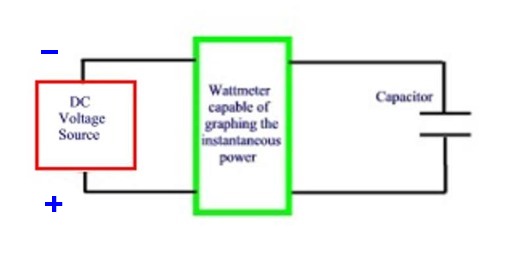
First, we have a capacitor on a constant DC source:
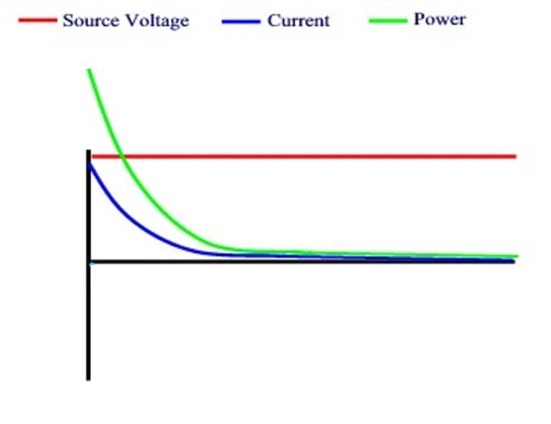
A graph of the voltages, currents, and power would look like this:
1) Electrons flow from the negative side of the source into one plate and it becomes negatively charged. At the same time, electrons are "pulled" off the other plate into the positive side of the source and this plate becomes positively charged.
2) The negative plate and the positive plate have an increasing potential difference across them during charging.
3) The energy in the current flow during charging is converted into an electrostatic field.
4) The potential difference between the plates of the capacitor is in opposition to the source voltage. It is of opposite polarity.
5) As the difference of potential across the plates rises, it opposes the source voltage to a greater and greater extent, and the current will decrease.
6) After the capacitor accumulates enough electrons on one plate and enough "holes" on the other plate, the voltage on the capacitor will be equal to and opposite of the source voltage and current will stop flowing because the two voltages cancel.
7) We could speak of the "opposition to current flow" that is in this circuit... and we could measure it in Ohms if we take the source voltage and divide it by the current flow.
8) If we do this at each instant in time, the Ohm value will be increasing as the current flow is decreasing. The Ohm value will start near zero and rise to near infinity as the capacitor charges.
9) The "variable nature" of the opposition to current flow of a capacitor could be mimicked with a variable resistor and a graph exactly similar to the graph above could be produced by varying the resistance in a precise manner.
10) The source voltage and the current are ?in phase? in the variable-resistive circuit.
11) The DC source had to expend a real amount of energy to push and pull the electrons through the opposition contained in the resistor.
12) If we assumed the variable resistor in (10) to be a load in our building and the voltage source to be a DC service from the utility, and we let the variable resistor mimic a charging capacitor, the energy expended in the source to make the current flow would be converted to heat in the resistor. This heat would increase the overall energy content of our building.
13) Anytime that voltage and current are in phase, the power is given in Watts.
14) Concerning the variable Ohms scenario, the "graph-capable" wattmeter in the diagram would give us a watt reading at each instant in time. This watt reading would be constantly changing until the current stopped flowing at some very large value of resistance. The Watt graph would start at a high level and fall to zero just as the current starts high and falls to zero. This would be represented by the green power graph in the image above.
15) A watt-hour meter would give a reading equal to the amount of energy used in the time period.
Back to the capacitor:
16) During the charging process, the voltage and current are "in phase? just like they are in the variable resistor.
17) The power that is measured at any given instant is equal to the source voltage multiplied by the current.
18) The DC source had to expend a real amount of energy to push and pull the electrons which charged the capacitor. This energy is converted into the electrostatic field in the capacitor.
19) If we assumed the capacitor to be a load in our building and the voltage source to be a DC service from the utility, and we let the capacitor charge, the energy expended in the source to make the current flow would be converted into an electrostatic field in the capacitor. This electrostatic field would increase the overall energy content of our building.
20) The "graph-capable" wattmeter in the diagram would give us a watt reading at each instant in time. This watt reading would be constantly changing until the current stopped flowing at the point where the capacitor voltage was equal and opposite to the source voltage. It would start at a high level and fall to zero just as the current starts high and falls to zero. This would be represented by the green power graph in the image above.
21) A watt-hour meter would give a reading equal to the amount of energy used in the time period.
Is there anything above that is incorrect?
[ January 28, 2005, 04:16 PM: Message edited by: crossman ]
First, we have a capacitor on a constant DC source:
A graph of the voltages, currents, and power would look like this:
1) Electrons flow from the negative side of the source into one plate and it becomes negatively charged. At the same time, electrons are "pulled" off the other plate into the positive side of the source and this plate becomes positively charged.
2) The negative plate and the positive plate have an increasing potential difference across them during charging.
3) The energy in the current flow during charging is converted into an electrostatic field.
4) The potential difference between the plates of the capacitor is in opposition to the source voltage. It is of opposite polarity.
5) As the difference of potential across the plates rises, it opposes the source voltage to a greater and greater extent, and the current will decrease.
6) After the capacitor accumulates enough electrons on one plate and enough "holes" on the other plate, the voltage on the capacitor will be equal to and opposite of the source voltage and current will stop flowing because the two voltages cancel.
7) We could speak of the "opposition to current flow" that is in this circuit... and we could measure it in Ohms if we take the source voltage and divide it by the current flow.
8) If we do this at each instant in time, the Ohm value will be increasing as the current flow is decreasing. The Ohm value will start near zero and rise to near infinity as the capacitor charges.
9) The "variable nature" of the opposition to current flow of a capacitor could be mimicked with a variable resistor and a graph exactly similar to the graph above could be produced by varying the resistance in a precise manner.
10) The source voltage and the current are ?in phase? in the variable-resistive circuit.
11) The DC source had to expend a real amount of energy to push and pull the electrons through the opposition contained in the resistor.
12) If we assumed the variable resistor in (10) to be a load in our building and the voltage source to be a DC service from the utility, and we let the variable resistor mimic a charging capacitor, the energy expended in the source to make the current flow would be converted to heat in the resistor. This heat would increase the overall energy content of our building.
13) Anytime that voltage and current are in phase, the power is given in Watts.
14) Concerning the variable Ohms scenario, the "graph-capable" wattmeter in the diagram would give us a watt reading at each instant in time. This watt reading would be constantly changing until the current stopped flowing at some very large value of resistance. The Watt graph would start at a high level and fall to zero just as the current starts high and falls to zero. This would be represented by the green power graph in the image above.
15) A watt-hour meter would give a reading equal to the amount of energy used in the time period.
Back to the capacitor:
16) During the charging process, the voltage and current are "in phase? just like they are in the variable resistor.
17) The power that is measured at any given instant is equal to the source voltage multiplied by the current.
18) The DC source had to expend a real amount of energy to push and pull the electrons which charged the capacitor. This energy is converted into the electrostatic field in the capacitor.
19) If we assumed the capacitor to be a load in our building and the voltage source to be a DC service from the utility, and we let the capacitor charge, the energy expended in the source to make the current flow would be converted into an electrostatic field in the capacitor. This electrostatic field would increase the overall energy content of our building.
20) The "graph-capable" wattmeter in the diagram would give us a watt reading at each instant in time. This watt reading would be constantly changing until the current stopped flowing at the point where the capacitor voltage was equal and opposite to the source voltage. It would start at a high level and fall to zero just as the current starts high and falls to zero. This would be represented by the green power graph in the image above.
21) A watt-hour meter would give a reading equal to the amount of energy used in the time period.
Is there anything above that is incorrect?
[ January 28, 2005, 04:16 PM: Message edited by: crossman ]
")
