Line voltage waveform

Status
Not open for further replies.

gar

Senior Member
Location
Ann Arbor, Michigan
Occupation
EE
100406-2154 EST

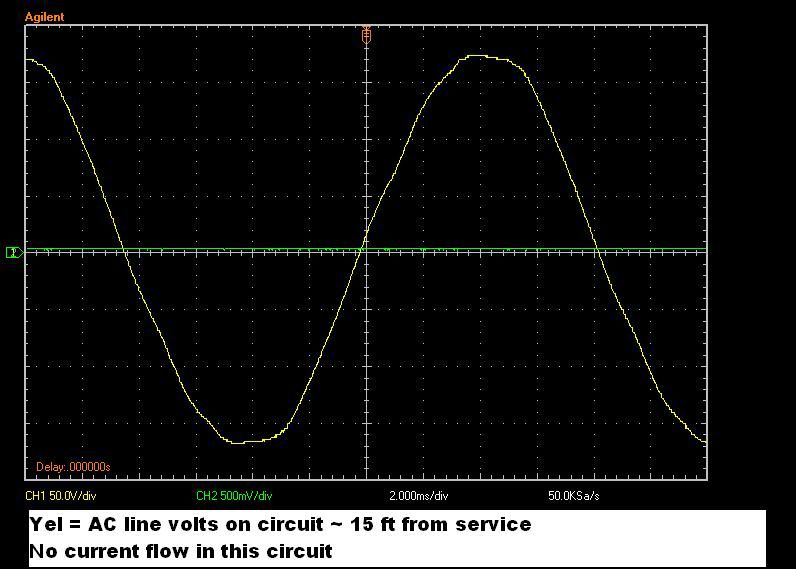
What does your AC line voltage waveform look like?

A member on this forum brought to my attention that his waveform was flattened on the top. He is a long way from me, and therefore not the same power company.

I looked at my waveform and it is similar to his. In years past I have had a very good sine wave.

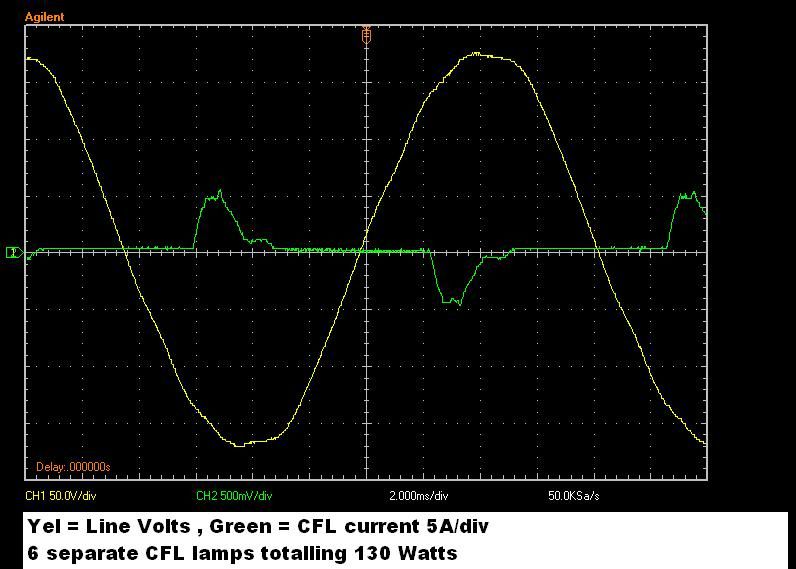
My conjecture is that there a very large number of loads on the grid that are rectifier capacitor input filter devices, and these could cause this distortion. Does this distortion get back as far as the high voltage transmission lines?

.
 

broadgage

Senior Member
Location
London, England
The flat topped sine wave illustrated is becoming more and more common.

The principle reason is indeed the widespread use of devices with a rectifier and capacitor input.
In such a device, the internal capacitor charges up to nearly the peak voltage of the input, therefore current is only drawn from the supply when the actual voltage is greater than the voltage to which the capacitor is already charged.
This results in a relatively large current being drawn only at the voltage peaks of the sine wave, with no current for the rest of the cycle.
Loads with rectifier/capacitor input include switched mode power supplies, electronic lighting ballasts and inverter drives for motors.

The waveform illustrated can also be caused by flourescent or discharge lamps on copper/iron ballasts, and by large battery chargers.

If a discharge lamp is connected to the supply via a traditional ballast, then it will only draw current from the supply during that part of the cycle when the actual voltage exceeds the lamp voltage, i.e. at the peaks.

Likewise when charging a battery, current will only flow from the line into the battery when the line voltage exceeds the battery voltage, i.e. at the peaks.
 

gar

Senior Member
Location
Ann Arbor, Michigan
Occupation
EE
100408-0741 EST

From a qualitative perspective the flattening of my waveform varies with the time of day. In the middle of the night, about 3 AM daylight time, I looked at the waveform and it was less flattened than during the day. This morning somewhat flatter, but not as much as I expect by mid afternoon.

Another observation is a tick at about 180*1.5/5 = 54 degrees. This corresponds with where I have measured at least one CFL to have its peak current. Somewhat after this point, about 180*1.7/5 = 61 degrees, is where the broad flattening starts. This ends about 180*3.1/5 = 110 degrees.

.
 

ggunn

PE (Electrical), NABCEP certified
Location
Austin, TX, USA
Occupation
Consulting Electrical Engineer - Photovoltaic Systems
100408-0741 EST

From a qualitative perspective the flattening of my waveform varies with the time of day. In the middle of the night, about 3 AM daylight time, I looked at the waveform and it was less flattened than during the day. This morning somewhat flatter, but not as much as I expect by mid afternoon.
Air conditioning loads?
 

gar

Senior Member
Location
Ann Arbor, Michigan
Occupation
EE
100408-0831 EST

ggunn:

Not likely air conditioning loads. I expect that most of these are an induction motor directly on the line. These will approximate a sinusoidal current waveform, and are lagging somewhat. The flat topping is very much what you expect from a diode capacitor load.

A quick Google search did not provide a good display of the input current to a rectifier and capacitor input filter. The following probably shows a current pulse wider than I expect.

http://www.vias.org/eltransformers/lee_electronic_transformers_04_03.html

.
 

ggunn

PE (Electrical), NABCEP certified
Location
Austin, TX, USA
Occupation
Consulting Electrical Engineer - Photovoltaic Systems
100408-0831 EST

ggunn:

Not likely air conditioning loads. I expect that most of these are an induction motor directly on the line. These will approximate a sinusoidal current waveform, and are lagging somewhat. The flat topping is very much what you expect from a diode capacitor load.

A quick Google search did not provide a good display of the input current to a rectifier and capacitor input filter. The following probably shows a current pulse wider than I expect.

http://www.vias.org/eltransformers/lee_electronic_transformers_04_03.html

.
To what do you attribute the time of day variation? AC loading is highest in mid to late afternoon, although correlation does not prove causation.
 

wptski

Senior Member
Location
Warren, MI
gar:

I have a Ideal VPM, a small plug in PQ device. It has a built in max of 3% voltage THD. If you remove the device from a receptacle it was show the last highest THD over 3% event. What it reads as 3% doesn't agree with other equipment I have like a Fluke 43B though which reads somewhat less.

Anyway! Most every day it will record a high event over 3% between 6:15am-6:30am. Right now the measued THD is over 3%. The last highest was 8.3% on 4/02 at 6:29am. Prior to that was 11.8% on 3/24 at 6:15am.

I talked to the person who designed the VPM and his guess was that the POCO switches something in at around that same time every day.
 

ghostbuster

Senior Member
gar:

I have a Ideal VPM, a small plug in PQ device. It has a built in max of 3% voltage THD. If you remove the device from a receptacle it was show the last highest THD over 3% event. What it reads as 3% doesn't agree with other equipment I have like a Fluke 43B though which reads somewhat less.

Anyway! Most every day it will record a high event over 3% between 6:15am-6:30am. Right now the measued THD is over 3%. The last highest was 8.3% on 4/02 at 6:29am. Prior to that was 11.8% on 3/24 at 6:15am.

I talked to the person who designed the VPM and his guess was that the POCO switches something in at around that same time every day.

Most likely the utility switches in their p.f.capacitor banks early each morning.
 

gar

Senior Member
Location
Ann Arbor, Michigan
Occupation
EE
100408-0920 EST

ggunn:

See post 4 by broadgage.

Computers, CFLs, VFDs, and anything else using rectifiers with capacitor input filters.

In my neighborhood there are a lot of CFLs. In my town and the adjacent one 5 miles away there are probably 50,000 students and a resulting large number of computers.

I am curious how far back toward the primary generators this flat topping occurs. My guess is that this propagates all the way back.

We need some power company people to tell us how this distortion varies as one follows the grid from the source to the end user. What does the current waveform look like at various points?

The following is just some interesting side material. The next paragraph is from a conversation with an ITC person, from memory and may not be correct.

The Michigan grid is all AC and primarily 345 kV. Total transmission capability is about 20,000 megawatts. The link from Ohio to Michigan along I75 is about 4,000 megawatts I believe. This is I believe three towers wide and two wires per insulator. There is another link along US23. Into Canada I believe the link drops to 230 kV. In the future there will be 765 kV AC in Michigan.

At the present time DC transmission is only practical for long distance transfer between a single source and a single destination. AC is a practical multi-drop system. Also no large transformers are made in the US anymore.

Trying to verify this I encountered the following, but did not find what I was really looking for.

http://www.aip.org/tip/INPHFA/vol-9/iss-5/p8.html
http://www.ferc.gov/industries/electric/gen-info/transmission-grid.pdf
http://en.wikipedia.org/wiki/Northeast_Blackout_of_2003

.
 

ELA

Senior Member
Occupation
Electrical Test Engineer
Here is my cosine wave at the house with no real load on a 15A circuit about 15 ft from the panel.
ACline-noCFLs_50V_div.jpg


Here is the same point with a bank of 6 CFLs running and the current measured to the CFLs.
ACline-120W6CFLs_50V_div_5A_Div.jpg


Probably need a few more CFLs to tear it up properly.
 
Status
Not open for further replies.
Top