gar
Senior Member
- Location
- Ann Arbor, Michigan
- Occupation
- EE
180507-0912
Problem:
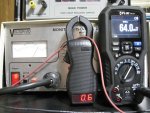
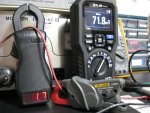
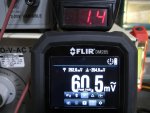
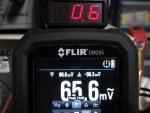
Using various instruments and calculations, a 10 ohm resistor as a load, and rectangular wave function generator what are the results of measurements across the load?
1. Average DC volts.
2. Actual RMS volts.
3. Fluke 87 AC RMS volts.
4. Fluke 27 AC volts.
5. Simpson 260 on AC volts.
6. Simpson 260 on Output.
For the following waveforms where the frequency is high enough for satisfactory coupling and averaging of the signal for the time percentages.
1. +10 V for 10% and 0 V for 90%.
2. +9 V for 10%, and -1 V for 90%.
3. 0 V for 10%, and -10 V for 90%.
How do a Simpson 260 and a Fluke 27 measure AC and get their readings? Define the philosophy.
.
Problem:
Using various instruments and calculations, a 10 ohm resistor as a load, and rectangular wave function generator what are the results of measurements across the load?
1. Average DC volts.
2. Actual RMS volts.
3. Fluke 87 AC RMS volts.
4. Fluke 27 AC volts.
5. Simpson 260 on AC volts.
6. Simpson 260 on Output.
For the following waveforms where the frequency is high enough for satisfactory coupling and averaging of the signal for the time percentages.
1. +10 V for 10% and 0 V for 90%.
2. +9 V for 10%, and -1 V for 90%.
3. 0 V for 10%, and -10 V for 90%.
How do a Simpson 260 and a Fluke 27 measure AC and get their readings? Define the philosophy.
.