Eric R 1973
Member
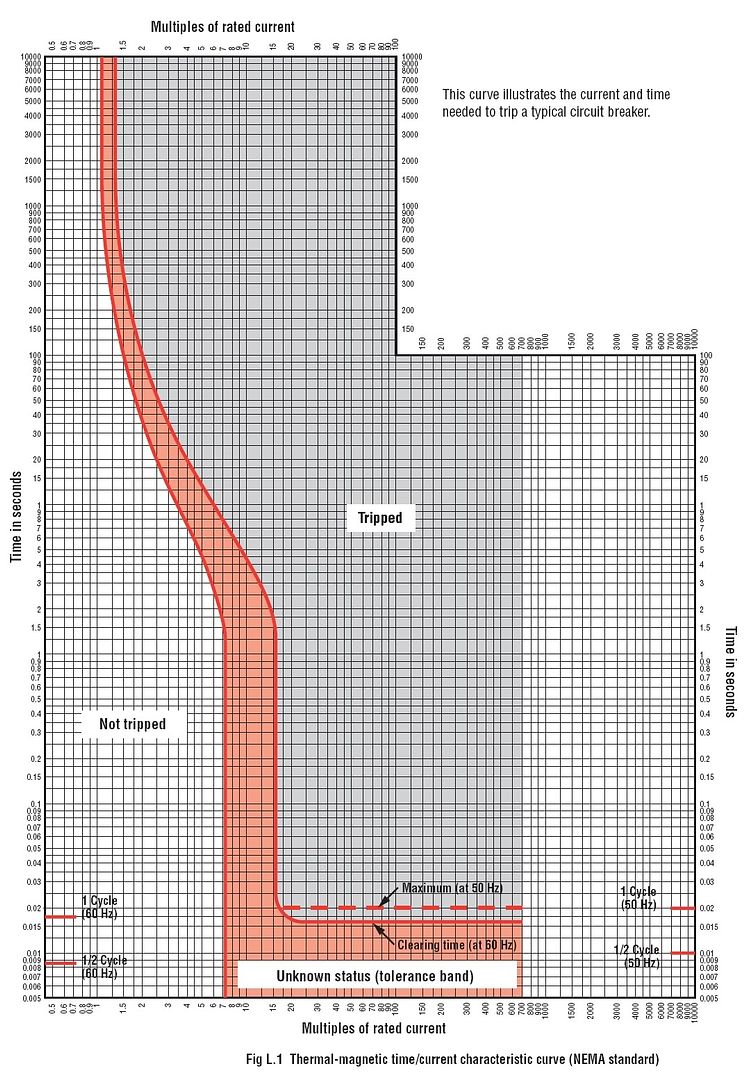
Does anyone know where i can find a table or chart of some kind for inverse time breakers. Describing how long it takes for it to open the circuit under various overload conditions.
It's I squared T. The more time, the less I squared. And on logarithm scales, inverse time does not plot as a straight line.inverse time breakers
........
BTW, a 1 to 10 second region is shown twice on this graph. The upper one shows going from 1 second to 15 seconds.........
Simply a typo of the digit 10.The upper one shows going from 1 second to 15 seconds.
Assuming this is a curve for a 1 A breaker, using an I^2 T value of 324 gives a pretty reasonable fit to the tolerance band within the interval 3 seconds to 100 seconds.
t in seconds........ calc'd I in amps
10..................... 5.7
100..................... 1.8
3..................... 10.4
For a 100 A breaker it'd be a value of 3,240,000 and the fit would be the same.
Only if this specific curve matched the performance of the breaker.For a 100 A breaker it'd be a value of 3,240,000 and the fit would be the same.

The OP asked for inverse time breakers.Only if this specific curve matched the performance of the breaker.
Why does it seem that you are being argumentative over the fact that I?t curves vary between breakers and the actual curves must come from the manufacturer?