161028-1257 EDT
MY guess is that cdynasty001 had his scope Y-axis set to AC coupling and not DC. This means the scope input looks like a capacitor and resistor in series, with the capacitor connectee to the square wave source, and the scope input connected across a 1 megohm resistance.
When you look at the waveform in post #1 it appears the curve is approaching 0 V. The square wave input frequency is too high for the decay to reach 0.
The following plots illustrate this on my scope. My scope has much better low frequency response in AC coupling mode. It is about an 0.1 mfd capacitor for isolation into a 1 megohm resistance.
This time I inverted color so the plots are more readable.
*****.
DC coupling 3.5 V/div, step change 4.4 div, 5 Hz sq-wave

.
*****.
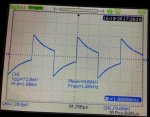
AC coupling 3.5 V/div, note step change 4.4 div, 5 Hz sq-wave.
63% drop occurs somewhat over 100 milliseconds

..
*****.
AC coupling 5 V/div, note step change 3 div, 0.5 Hz sq-wave.
Same voltage change as before just different scale factor.
63% change about 140 milliseconds. This plot clearly shows approach to 0 V.

.
.