sags & swells

Status
Not open for further replies.
Location
NE (9.06 miles @5.9 Degrees from Winged Horses)
Occupation
EC - retired
Using a Fluke 43B to catch sags & swells. Laptop is connected as well so I can review the results & zoom in. Voltage check is from a remote rod to a metallic box inside my shop. (This in prep for a longterm recording at another location.)

Meter display caught a 2.155 volt spike. Laptop displays a max of 1.096 volt. What gives?
 
ptonsparky said:
Using a Fluke 43B to catch sags & swells. Laptop is connected as well so I can review the results & zoom in. Voltage check is from a remote rod to a metallic box inside my shop. (This in prep for a longterm recording at another location.)

Meter display caught a 2.155 volt spike. Laptop displays a max of 1.096 volt. What gives?

I don't know, but did you notice they seem to be off by a factor of 2.

Is there any way to produce a 10 volt spike? It would be interesting to see if you are still off by a factor of 2, or if you are still off by only 1 volt.

Steve
 
080806-1926 EST

ptonsparky:

I have no experience with the 43B but I took a quick look at the specifications. This is a complex instrument with many functions. What you need to do is study the manual and figure out exactly what the different funtions do.

For example the transient funtion will process the signal in a much different way than sag and swell. Transient will clearly relate to a peak or instantaneous recording of the signal. A sag and swell will probably involve some averaging time constant and thus would give quite different results than in transient mode.

How does the laptop relate to the 43B? Does it record data from the 43B or does it have some other signal conditioning unit that is looking at the same signal as the 43B?

You very much need to know what kind of problem you want to troubleshoot to determine how to use the 43B.

One test you could perform at your current location to simulate sags and swells would be to take a moderate load like a 10 ohm resistor and cycle it on and off on a #14 branch circuit of maybe 100 ft. Monitor the two voltages, loaded and not loaded at the load with the 43B in your sag swell mode, and with a Fluke 87 and compare the results. Maybe use a 2 to 4 second on-off cycle. Make this long enough that the 87 readings stablize.

A 1400 W heater will be about 10 ohms.

.
 
All other functions appear to read properly? One issue could be a multiplier in the PT CT, selection. If the 43B offers this.
 
The transient function of the meter is not available for communication to the laptop. I believe the laptop records from the 43B or thru it. I will try to set the baud rate of my communications port up a bit higher & see if I can duplicate the problem or eliminate it.

Yes, the transient function is quite a bit faster than S/S and can catch those little spikes on the sign wave, up or down. Much like recording multiple shots of the sine wave. I was suprised to see the 2v spike, but even more suprised to not see it on the laptop.

I seems to work in all other modes that are allowed with the laptop.

I will make a call to Fluke for a little support if need be.
 
Last edited:
080806-2046 EST

ptonsparky:

Because I know nothing about the 43B I am shooting in the dark.

Relative to RS232 communication:

Use a laptop with a real 232 port, and not a USB to 232 adapter. My IBM Thinkpad has a docking station with a true 232 port and I communicate very reliably at 115.2 kbaud.

Use the highest baud rate the Fluke has available up to 115.2 kbaud. If 8 data bits are not required for the data, then use 7. If parity is not essential, then use no parity. Use one stop bit. These settings would provide the fastest data transfer rate.

Even at 115.2 kbaud you should not need to use handshaking for receiving data at a modern computer.

If you need more than about 6 ft of cable between the source and destination at 115.2 kbaud, then our I232 Isolator system might be of value to you.

I am going to guess that there are different averaging times in the Fluke 43B depending upon the recording times. Or the possibility that min and max values within a recording time are saved per recording time. But even so to fit within my expectation of the meaning of sag and swell I would expect averaging over at least 1 full cycle to get an RMS value. Whereas the transient mode won't measure the RMS value but some form of a pulse.

I can not currently open the manual and thus see what it says.

.
 
The transient values are shown in +/- peak, triggered with 20, 50, 100 or 200% over peak values.

Sometimes a unexplainable/odd short event in S/S will be a transient.
 
080807-0619 EST

ptonsparky:

Thinking more about how the 43B may work.

These comments are guesses but may help you try to figure out what the instruction manual says about the operation of the 43B.

No matter what measurement is made it will be a sample and this sampling will have some rate of occurrence. Internal to the 43B there will be some amount of available memory for storage of these samples. From the scope specs it indicates 512 samples. This is quite small. This same memory in one way or another will be used for the other measurements.

RMS measurements imply an averaging time. For a moving coil type of meter movement this might be about 1/10 second ( 6 full wave cycles at 60 Hz ). For digital meters it might be somewhat longer. For the 43B, or any other electronic signal processor, the minimum possible at 60 Hz would be 8.3 MS using only 1/2 cycle. Using a non-integral number of half cycles until the number of half cycles is 10 or more may not make much sense in terms of a useful meaning of RMS.

When measuring sags and swells I doubt that short transients have any effect on the reading except in relation to the amount of energy they represent relative to the total energy over the averaging period.

When data is transferred to the computer by RS232 I suspect it is the data from the internal memory rather than raw sampled data. If this is true, then whatever is displayed on the 43B should be replicated at the computer.

For the 43B there are two possible ways an RMS measurement could be made.

The first would use an analog circuit to determine the RMS value over some averaging time. The output would be a varying DC signal that is sampled by an analog-to-digital converter at some rate for further digital processing.

The second would use the analog-to-digital converter to sample at some high rate relative to the signal. The sample values would be squared, added over some time period, divided by that time period to get an average, and the square-root of that average to produce a value of the RMS value for that averaging time period. These values could be further averaged, or their min and max values might be saved. Raw sampling in this case might be 128 samples per half cycle at 60 Hz which is 8.3/128 = 64.9 microseconds between samples.

There may be parameters in the computer software that determine further processing of the data from the 43B. These might be the source of the difference in the data displayed at the 43B vs the computer.

.
 
You said the meter was correct but the laptop was not (or different)?
If so then

I doubt it would have anything to do with baud rate because it would not communicate with the laptop "real time".

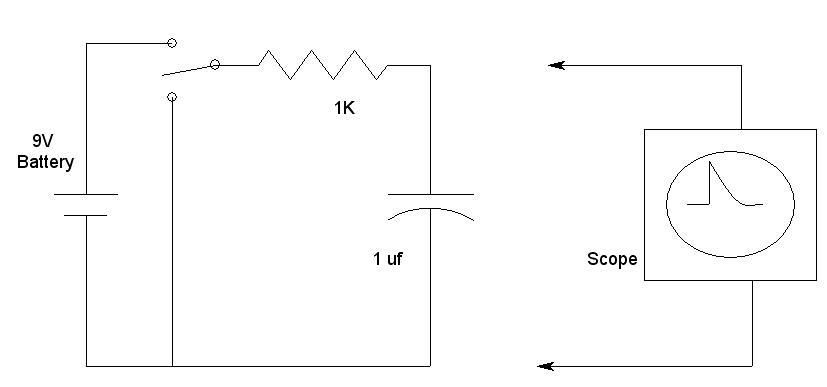
You can try this to generate a spike of known amplitude to experiment with your settings. You can change the battery, resistor and cap to vary amplitudes and duration.

spike-1.jpg
 
080807-0852 EST

wasasparky:

It would appear that ptonsparky may want to look at at stray ground potentials.


ELA:

Your circuit would be useful to test the transient or scope mode, but not likely the RMS sag-swell function. If the 43B truly reads the RMS value of an input including the DC component, then switching the battery on and off into a resistor would be sufficient to provide a signal for sag-swell.

I am guessing that the 1 MS time constant of the RC circuit would be too short for an RMS sag-swell response.

The waveform shown on the scope display would apply for the charging waveform across the resistor. If the flat left part of the curve was raised up to the peak, then the curve would apply to the capacitor voltage discharge curve .

.
 
gar said:
080807-0852 EST
wasasparky:
It would appear that ptonsparky may want to look at at stray ground potentials.

I did not want to assume anything.
OP indicates sag-swell, I would assume (there I went and did it anyway) this would be referenced with the service/building ground.
 
gar said:
080807-0852 EST


ELA:

Your circuit would be useful to test the transient or scope mode, but not likely the RMS sag-swell function.

Only meant for transients

The waveform shown on the scope display would apply for the charging waveform across the resistor. If the flat left part of the curve was raised up to the peak, then the curve would apply to the capacitor voltage discharge curve .

.
My bad, meant to interchange the cap and the resistor in the diagram
 
080807-1843 EST

ptonsparky:

I suggest doing your experiment as follows:

For the "reference point" use the ground electrode at the service entrance.
Locate the 43B near the "reference point" and power it with AC or an external battery so it can run for 24 hours.

I do not think you need to isolate the computer and the 43B from AC power. The 43B specs indicated optical isolation on the RS232 port. The two input channels on the 43B should allow you to make a differential measurement.

If you need to use battery power then it might require more than one large car battery. You might get about 0.8 KWH from one battery. Presently I am checking my ThinkPad and while charging AC input is 0.5 A at 120 V or about 60 W. At 99% charged it is down to about 0.3 A and I never operate at reduced screen brightness.

To experiment checking ground voltage in my yard I use a couple long extension cords to reach the probe. For the probe I use a 10" or 12" screw driver and push it a few inches into the ground.

I have made measurements with both a Fluke 27 and an oscilloscope and they correlate. However, the scope provides phase shift information and the reason for its use. I did find the phase angle changed from one area of the yard to another. My maximum voltage was in the range of 200 MV as read by the 27. In some areas there was considerable waveform distortion and it varied in a given location.

To study your calibration problem of the 43B try the experiment with a 1400 W heater being turned on and off that I discussed in a previous post. At my workbench I get a change of 124.7-117.3 = 7.4 volts from my 10.6 ohm test heater. Thus, source impedance is 7.4/(117.3/10.6) = 0.67 ohms. A test signal in this range should be sufficient to evaluate the calibration and measurement method of your 43B.

You need to try to prove that the one turn loop formed by the earth and your wire to the test probe is not picking up any inductively coupled signals. Also it might be necessary place a low pass filter at the 43B input to remove high frequency noise. A test for the base noise level might be done with a 200 to 300 ft by 1 ft loop connected to the instrument input. The length of this loop would be on the order of the maximum distance tou need to probe from the reference point.

Maybe a phone call would be appropriate to discuss this in more detail.

.
 
He doesnt have to leave his computer connected to the 43b at all. You can log the readings for the 24hr period and then download them to your computer useing the Fluke PQ software and then analize the readings from the comfort of the office. The dariy barn I did some work at wasnt a very comfortable enviroment to set and look at a computer for long peroids of time. lol. But anyway there is no need to set with your computer connected to the meter, you can just look at the meter for that much. Unless you just want to. And I would have to check I dont think that the software updates in real time anyway, I think that you just get screen shots that you download so that may be were you have a problem with voltage inconsistencys, maybe maybe not.
 
I've never used this meter, but I'm just gonna make a wild guess and suggest that the meter was indicating peak to peak and the laptop was indicating baseline to peak
 
080807-2048 EST

ptonsparky:

I have now opened the instruction manual on a different computer.

The manual in not very clear and therefore runing different controlled tests would be necessary to really find out how the device works.

As I said before there is only a small amount of data storage in the 43B. There is enough for 240 points across the screen.

In sag and swell mode it appears that the RMS value of the waveform is measured for each full cycle, 16.7 MS. This value becomes one sample point. A max register and a min register retain the largest and smallest samples during a time period. This time period is called a plot interval, and the minimum plot interval is 1 second. This means 60 samples were used to collect data to get the two values for this 1 second plot interval. Having said this based on what I thought I read and looking back at graph SAGS and SWELLS on page 9 I am confused. The graph on page 11 maybe what I am describing. 240 sample points of 1 sec equate to a full screen of 4 minutes. If more data is collected, then compression occurs.

I have not gotten to the part on RS232 output.

.
 
The advantage of the laptop connection, while recording, is the ability to zoom in on a certain time period. The 43 will save and review the information for __ hours of recording but it is compacted to fit one screen and I loose the detail on either side of the major event(s). The laptop allows me to zoom in to 1 sec/div vs 6 minutes.

Once the information has been stored on the 43 the detail is not available to review on a laptop at a later date. You get a screenshot only. Still better than a poke in the eyeball with a sharp stick.
 
ptonsparky said:
The advantage of the laptop connection, while recording, is the ability to zoom in on a certain time period. The 43 will save and review the information for __ hours of recording but it is compacted to fit one screen and I loose the detail on either side of the major event(s). The laptop allows me to zoom in to 1 sec/div vs 6 minutes.

Once the information has been stored on the 43 the detail is not available to review on a laptop at a later date. You get a screenshot only. Still better than a poke in the eyeball with a sharp stick.
Once downloaded to your PC and saved. Recall, place cursor over graph, right click and a menu opens up. Go to scaling and select what you want. You have the same options that your speaking of. I do that all the time. It's the same option that you'll find in Fluke View for Scopemeters too.

The only thing is that after 24 hours of recording, I'm doubting wether or not that one can zoom down to 1s/div. Normally the longer the recording, the coarser the zoom. If you can go down to 1s/div no matter what the recording lenght is while connect to a PC, that is a big advantage.
 
Status
Not open for further replies.
Top