Power factor and VA vs Watts

Status
Not open for further replies.

gar

Senior Member
Location
Ann Arbor, Michigan
Occupation
EE
100413-1710 EST

Steve:

The green curve is just plain wrong.

Full wave rectification with a purely resistive load does not change anything. During the first half cycle a positive sine wave is squared, and the second half cycle a negative half cycle is squared. Whether the half sine wave is positive or negative when it is multiplied by itself, squared, the result is positive.

.

.
 

gar

Senior Member
Location
Ann Arbor, Michigan
Occupation
EE
100413-1722 EST

Ham:

Whether you want a + sign or - sign depends upon how you want to relate synchronization to the original voltage sine wave.

The minus sign is what is correct and in the standard definition of the trig identity. See many books on the sin^2 function. For example: "Handbook of Mathematical Tables and Formulas", by Burington, 1948, reprinted 1954, Bureau of Ordnance, Navy Department, Washington, D.C., USA. Page 18 near the bottom. The same page in the 1943 printing.

.
 

Smart $

Esteemed Member
Location
Ohio
Wow! Got a discussion going now :cool:

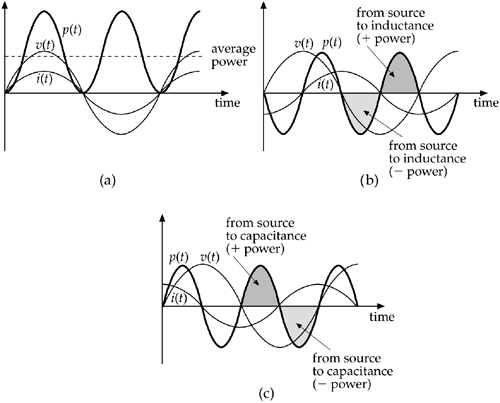
Yes, Pav is zero. But the instantaneous power has positive, zero, and negative values.
To that extent your chart is incorrect. If the current is positive and the voltage is negative the power is negative. No ifs. No buts. Yet, according to both your graph it is always positive. That's not right.
Somehow, I think your looking at my charts real power curve and calling it instantaneous power. Instantaneous power is P=VI... and is not instantaneous real power. As you have noted, instantaneous power is both positive and negative when the power factor is less than 1. Yet when the power factor is 1, the instantaneous power is positive only (except for the instant every half-cycle that it is zero). And this instantaneous power is also the instaneous real power. So the Real Power portion of instantaneous power. is always positive. AFAICT, at least gar agrees with me on this.


The other point I take issue with is your comment:
FWIW, instantaneous power represents apparent power
Instantaneous power is power. One Watt is one Watt. Nothing apparent about it.
Not in complete disagrement with you, but the issue we are discussing is a little more complex than this. In the sense that one watt is generated and tranmitted you are correct. But if at the load end of that one watt is a power factor of 0.707 (which is a 45? phase shift in current compared to voltage), then only 0.707 watt is consumed and the other 0.203 watt is necessary for the load to work properly but in the end it is wasted.
 

Smart $

Esteemed Member
Location
Ohio
Now I'm confused. I thought that Pavg referred to power averaged over time. How can you have an instantaneous value for something averaged over time that is different for different points in time?
Food for thought: If you have steady state power, why would it need to be an averaged value? Answer: Because it goes up and down and continuously changes. Thus there has to be instantaneous values.

But like I said, I'm a long time out of school and I've slept several times since then. :grin:
Me too... and I could probably call this discussion a self-inflicted refresher course :D
 

gar

Senior Member
Location
Ann Arbor, Michigan
Occupation
EE
100413-1733 EST

steve66:

If you have seen the erroneous green curve in many books, then those books are wrong.

Here are some values for small angles:

Angle ... sin ....... sin^2

00..... 0 ........... 0
05..... 0.087 ..... 0.0076
10 .... 0.174 ..... 0.0302
15 .... 0.259 ..... 0.0670
20 .... 0.342 ..... 0.1170
25 .... 0.423 ..... 0.1786
30 .... 0.500 ..... 0.2500
35 .... 0.574 ..... 0.3290
40 .... 0.643 ..... 0.4132
45 .... 0.707 ..... 0.5000
50 .... 0.766 ..... 0.5868

Note: at small angles the sin is close to linear. If a straight line is drawn from 0 to 45 deg the value at 22.5 deg is 0.38268 - 0.35355 = 0.029 difference. If a best fit was done, the error would be about 0.015 .

Plot your own curve and see what it looks like. There is no difference in the squared value when the sin values are negative.

.
 

Smart $

Esteemed Member
Location
Ohio
I've not heard these terms before. Exactly how are you defining them?
Yeah... forget I said that. This includes ggunn, too... and well everyone that reads that part of my discussion). And FWIW, my first graph/chart is more correct, I believe... but I did discover an error in my math. Nothing major... just influenced the scaling of the waveforms.

I'm also going to try and delete my last depiction on Photobucket, but I did that with my first and it seems to keep reappearing.:mad:

Anyway, here is the latest revision...

PFVAW4.gif


This is where i tell you it is time to get complex:roll:.

S = P + Q, where S = complex power ( or apparent power or VA), P = real power (Watts), Q = Reactive power (VARs). All three quanities are vectors, with magnitude and phase angle.
I complexly agree :cool:
 

Smart $

Esteemed Member
Location
Ohio
There is no waveform associated with Pavg.

(edit to add) As ggunn said, Pave is defined as an integral over 1 period. It is a magnitude, similar to Vrms, Irms. No waveforms here. These are all magnitudes - no phase angles involved.

The rms definitions were given earlier - so I won't repeat.

Pavg = (1/T) ∫v(t) i(t) dt

For sinusoidal waveforms, driving resistive loads:
Vrms X Irms = Pavg

I think that is why the industry came up with the rms concept was so this relationship was true.

Can't use Vavg and Iavg, cause those magnitudes are zero.

Yes, as you said a lot earlier, it's complex, but the terms are clearly defined.

Just an aside: RMS power is just sales/marketing hype. It has no use in our industry.

edit: Whoops missed ggunn's post>

cf

I never said there was a (non-steady-state) waveform associated with Pavg, but there is a waveform associated with apparent, real, and reactive power. You even said so in your prior post: "All three quanities are vectors, with magnitude and phase angle."

As for RMS power, e.g. a spec in Wrms, is definitely a misnomer, andhas no use in our industry... but I utilize the watts-rms spec for speakers more often than my wallet cares for me to.
 

Smart $

Esteemed Member
Location
Ohio
... However, I think your graph still has a few problems. I think the real power has to be in phase with the voltage (for the reason GAR talked about).
[Re-]corrected above...

Also, I don't think the real power is a sine wave. It should be the product of current times voltage, which should be a sine squared curve (which I think looks a little different than a standard sine wave.)
Yes, it is a sine wave. gar is handling this admirably IMO :cool:
 

Cold Fusion

Senior Member
Location
way north
... But if at the load end of that one watt is a power factor of 0.707 (which is a 45? phase shift in current compared to voltage), then only 0.707 watt is consumed and the other 0.203 watt is necessary for the load to work properly but in the end it is wasted.
No, not wasted. It is just sent back to the generator. The part that is wasted is the losses in the transmission of the .293W, shuttling it from the gen to the load and banc to the gen. The .293 is still available to use again, bu tthe extra power it took to get it out and back are gone.

cf
 

gar

Senior Member
Location
Ann Arbor, Michigan
Occupation
EE
100413-2236 EST

A question for you to ponder:

I have a voltage source of which I can accurately control the turn on and off points. Connected to this source is a resistive load.

If I turn the voltage source on at the peak of the voltage waveform and keep it on for exactly one cycle, then is the energy transferred to the resistor different or the same as if the turn on was at the voltage zero crossing and one full cycle was the on time?

.

.
 

ggunn

PE (Electrical), NABCEP certified
Location
Austin, TX, USA
Occupation
Consulting Electrical Engineer - Photovoltaic Systems
Food for thought: If you have steady state power, why would it need to be an averaged value? Answer: Because it goes up and down and continuously changes. Thus there has to be instantaneous values.
Of power, yes; of average power, no. Pavg, Irms, and Vrms are all flat lines in the time domain. Put another way, yes, there are instantaneous values for Pavg, etc, but they are all the same in the time domain for a given steady state system, i.e., a flat line. If you are turning loads on and off, then yes, you'll have a change and a settling period every time you throw a switch, but that's not a steady state system. If you are talking about something like a complex audio waveform where amplitude and frequency are constantly being modulated, then that's not a steady state system, either.

As to the shape of the y=sin^2 x curve, I am making a note for myself to look it up in my EE401 textbook when I get home today; I am pretty sure I still have it on a shelf somewhere. That published curve that some of us are having such a problem with looks really familiar, though; it's an intermediate result of rms calculations.
 
Last edited:

steve66

Senior Member
Location
Illinois
Occupation
Engineer
100413-2236 EST

A question for you to ponder:

I have a voltage source of which I can accurately control the turn on and off points. Connected to this source is a resistive load.

If I turn the voltage source on at the peak of the voltage waveform and keep it on for exactly one cycle, then is the energy transferred to the resistor different or the same as if the turn on was at the voltage zero crossing and one full cycle was the on time?

.

.

The energy is the area under the power curve, so it would be the same in both cases.
 

Smart $

Esteemed Member
Location
Ohio
No, not wasted. It is just sent back to the generator. The part that is wasted is the losses in the transmission of the .293W, shuttling it from the gen to the load and banc to the gen. The .293 is still available to use again, bu tthe extra power it took to get it out and back are gone.

cf
You're making it sound like the system on the whole is a finely tuned RCL oscillator. It is not. You'd have to have some major PFC caps hiding [and connected] somewhere. ;)
 

LarryFine

Master Electrician Electric Contractor Richmond VA
Location
Henrico County, VA
Occupation
Electrical Contractor
If I turn the voltage source on at the peak of the voltage waveform and keep it on for exactly one cycle, then is the energy transferred to the resistor different or the same as if the turn on was at the voltage zero crossing and one full cycle was the on time?
I would think that one complete cycle, regardless of the start-stop points, would exhibit the same averages of everything.
 

Smart $

Esteemed Member
Location
Ohio
Of power, yes; of average power, no. Pavg, Irms, and Vrms are all flat lines in the time domain. Put another way, yes, there are instantaneous values for Pavg, etc, but they are all the same in the time domain for a given steady state system, i.e., a flat line. If you are turning loads on and off, then yes, you'll have a change and a settling period every time you throw a switch, but that's not a steady state system. If you are talking about something like a complex audio waveform where amplitude and frequency are constantly being modulated, then that's not a steady state system, either.
Sorry for the delayed response... seemed to have missed your reply on earlier views.

Anyway... I don't even recall how I got drawn into a Pavg discussion. When I mentioned the term "steady-state", I was referring to a flatline curve plot, i.e. always the same value when plotted vs. time. I believe somehow Pavg came up because you can't determine real and reactive components of instantaneous power without entering the time domain. This is because the waveform of both real and reactive power, though at double the frequency, are aligned to the voltage waveform (the powers' zero values occur at voltage's half- and quarter-cycle points, respectively) rather than aligned with the instantaneous power or current waveform. So the discussion of instantaneous real and reactive power values has to enter the time domain. Pavg, Vrms, and Irms are not in the picture.

As to the shape of the y=sin^2 x curve, I am making a note for myself to look it up in my EE401 textbook when I get home today; I am pretty sure I still have it on a shelf somewhere. That published curve that some of us are having such a problem with looks really familiar, though; it's an intermediate result of rms calculations.
First, I don't know why everyone keeps reverting to using plots of the sine function. Voltage and current waveforms, in discussing phase relationships and complex numbers, are determined and plotted with the cosine function.

That said it would be y = cos?(x) = (1+cos(2x))/2.

The reason we use rms values is because of the relationships P=EI, P=E?/R, and P=I?R, which are all the same formula with substitutions of Ohm's Law. For individual scenario, R is the same in the latter two. As such, P values are directly proportional to the values of E? and I?. Taking the mean value of instantaneous E? and I?, yields Vrms and Irms.

However, what we are discussing here is the basic P=EI, or rather P=VI, and being that real power is where V and Ireal are aligned sine waveforms, though possibly of differing values. We can although, determine the shape of the waveform in that each is essentially a scalar value (let's say "a" and "b" respectively) times cos(x). Thus no matter what their values are, the P waveform will be a?b?cos?(x), and this is where the sine function squared comes into play...
 

Hameedulla-Ekhlas

Senior Member
Location
AFG
Sorry for the delayed response... seemed to have missed your reply on earlier views.

Anyway... I don't even recall how I got drawn into a Pavg discussion. When I mentioned the term "steady-state", I was referring to a flatline curve plot, i.e. always the same value when plotted vs. time. I believe somehow Pavg came up because you can't determine real and reactive components of instantaneous power without entering the time domain. This is because the waveform of both real and reactive power, though at double the frequency, are aligned to the voltage waveform (the powers' zero values occur at voltage's half- and quarter-cycle points, respectively) rather than aligned with the instantaneous power or current waveform. So the discussion of instantaneous real and reactive power values has to enter the time domain. Pavg, Vrms, and Irms are not in the picture.


First, I don't know why everyone keeps reverting to using plots of the sine function. Voltage and current waveforms, in discussing phase relationships and complex numbers, are determined and plotted with the cosine function.

That said it would be y = cos?(x) = (1+cos(2x))/2.

The reason we use rms values is because of the relationships P=EI, P=E?/R, and P=I?R, which are all the same formula with substitutions of Ohm's Law. For individual scenario, R is the same in the latter two. As such, P values are directly proportional to the values of E? and I?. Taking the mean value of instantaneous E? and I?, yields Vrms and Irms.

However, what we are discussing here is the basic P=EI, or rather P=VI, and being that real power is where V and Ireal are aligned sine waveforms, though possibly of differing values. We can although, determine the shape of the waveform in that each is essentially a scalar value (let's say "a" and "b" respectively) times cos(x). Thus no matter what their values are, the P waveform will be a?b?cos?(x), and this is where the sine function squared comes into play...

I am agree with you for formula to start with Cosine. I have seen alot of circuit system analysis books and the formula starts with cosine. I have already mentioned this in post#179

gar,
I am completely agree with your explaination but regarding to your equation for instantaneous real power, are you sure it is like this.
I know the below equation or you may have brought some trigometery changes.


P = P + Pcos2wt......(1)

and see the graph too

But I have never seen such a circuit analysis and design book to start formula with sine. There must be a reason.
 

steve66

Senior Member
Location
Illinois
Occupation
Engineer
First, I don't know why everyone keeps reverting to using plots of the sine function. Voltage and current waveforms, in discussing phase relationships and complex numbers, are determined and plotted with the cosine function.

For the most part, just because I'm being sloppy with the math. Also because the sin ^2(x) = (1-cos2x)/2 was in my list of trig identities, but cos^2(x) was not.

Also, because the only difference between the two is a phase shift. That also means the only difference between the two is where we call time=0.

BTW, how do you get the little superscripted "2" after the cos?

Steve
 

Smart $

Esteemed Member
Location
Ohio
For the most part, just because I'm being sloppy with the math. Also because the sin ^2(x) = (1-cos2x)/2 was in my list of trig identities, but cos^2(x) was not.
Trig identities
2 sin?(x) = 1 - cos(2x)
2 cos?(x) = 1 + cos(2x)​

For the latter, start with identity cos(a + b) = cos(a)cos(b) - sin(a)sin(b).

Let a = b = x

cos(x+x) = cos(x)cos(x) - sin(x)sin(x)
cos(2x) = cos?x - sin?x

Now use Pythagorean identity sin?(x) + cos?(x) = 1 to substitute for sin?(x).

cos(2x) = cos?(x) - [1 - cos?(x)]
cos(2x) = 2 cos?(x) - 1

From there it just takes a little rearranging...

2 cos?(x) = 1 + cos(2x)


Also, because the only difference between the two is a phase shift. That also means the only difference between the two is where we call time=0.
Quite true, yet not quite conventional without so noting.

BTW, how do you get the little superscripted "2" after the cos?
Hold down ALT key while also keying 0178 on the num pad, then release the ALT key (You may have to turn on Num Lock).
 
Status
Not open for further replies.
Top