Sorry for the post and run yesterday. I'll be around today to take care of this more promptly if anyone has input.
UMMMM is there a graphic to go along with this question?
There is a picture inserted in the post. Here is a direct link to it:
http://i254.photobucket.com/albums/hh84/bonddr24/screenshot.jpg
gar said:
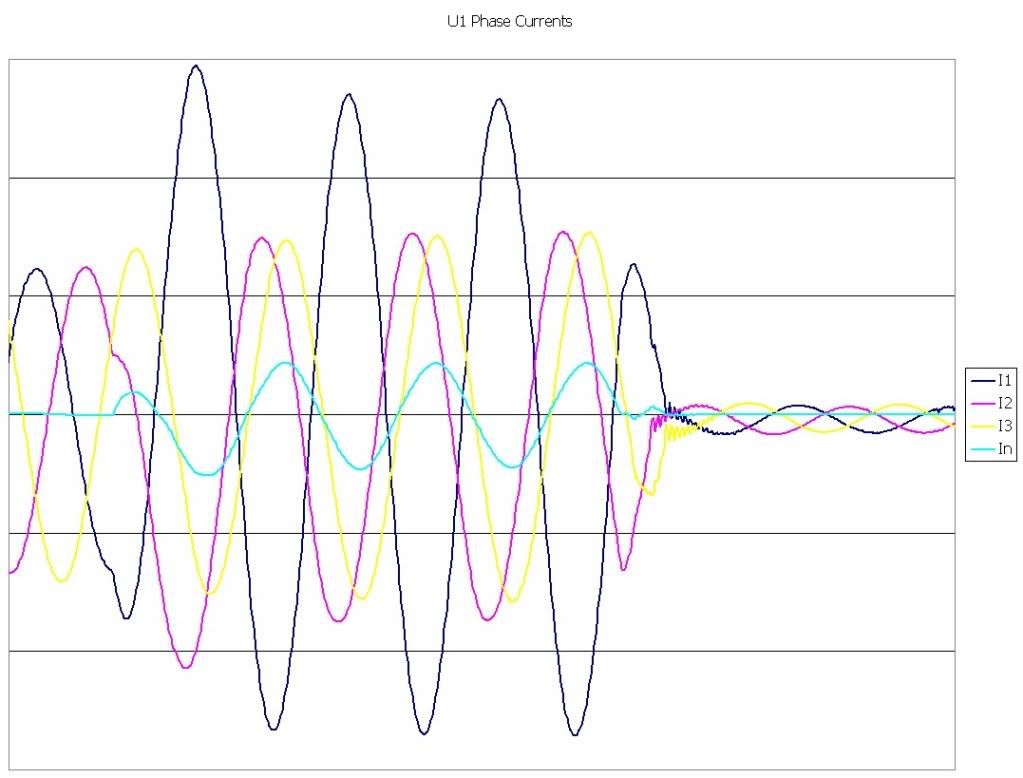
There is a change in both I1 and I2 at the time current starts to flow in the neutral. The blip in the curves. There is excess current from I1 to In. Not so much from I2 to In.
I noticed the blip, but didn't know what to make of it. Does excess current from I1 to In indicate a ground fault on that phase?
gar said:
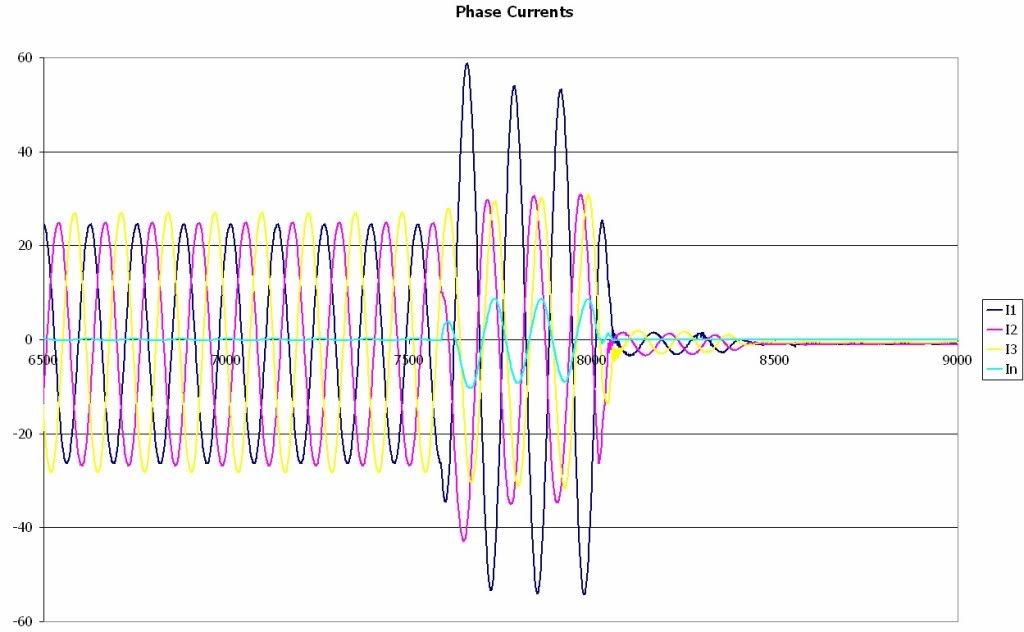
Why is there current after the breaker opens?
Probably just the way I have the graph scaled. I was more concerned with the stuff that happened before the breaker tripped. They all go flat just off the page to the right. There was a breaker misoperation, so the delay may be the time it took for the next breaker to operate.
My biggest questions are as follows:
1) Does the high current in phase 1 in conjunction with the neutral current mean a phase to ground fault?
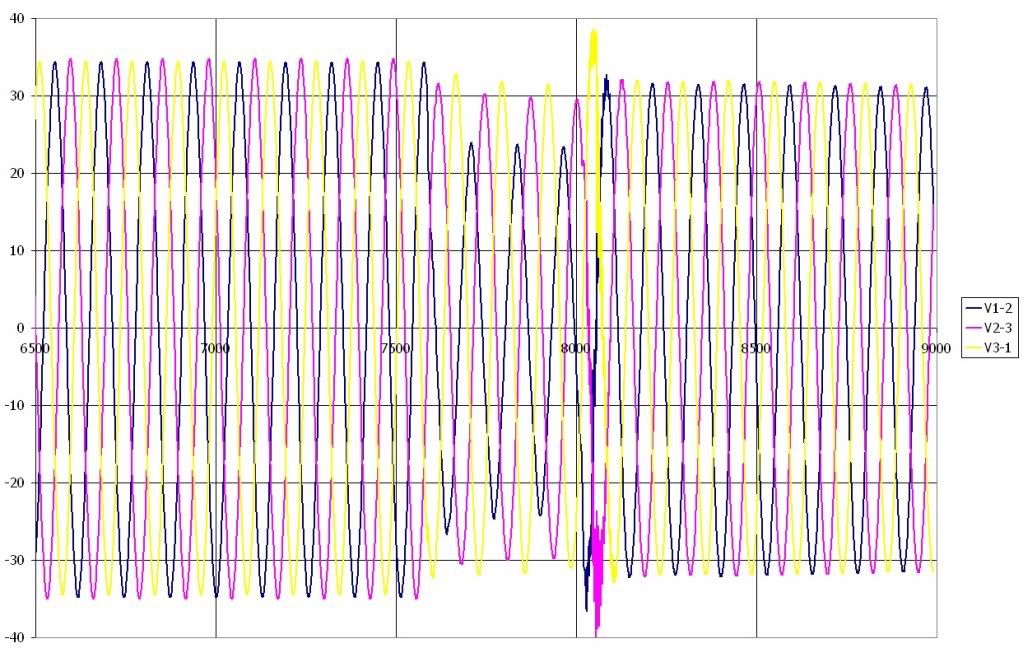
2) Is there any significance to the change in position of phases 2 and 3? They are both shifted towards each other for the ~3.5 cycles before the breaker tripped.
3) Does neutral current simply indicate a phase imbalance, or does it automatically mean a ground fault?
4) Is it possible to have a phase imbalance without neutral current? I didn't think it was, but another unit that was connected to this same mess recorded the exact same changes in the phases (i.e. phase 1 increased and phases 2 and 3 shifted towards each other) but it recorded no neutral current. Is that possible, or do we have a busted CT somewhere that should have recorded neutral current on that unit as well?
I'm getting ready to break out the Power Systems Analysis textbook and see what I can remember, but its been 10 years since college and I haven't used this stuff since that time.
")
I'm not sure how it will go.