Loading Diagram

Status
Not open for further replies.
Thanks for the diagram. I am still waiting for the engineers answer.

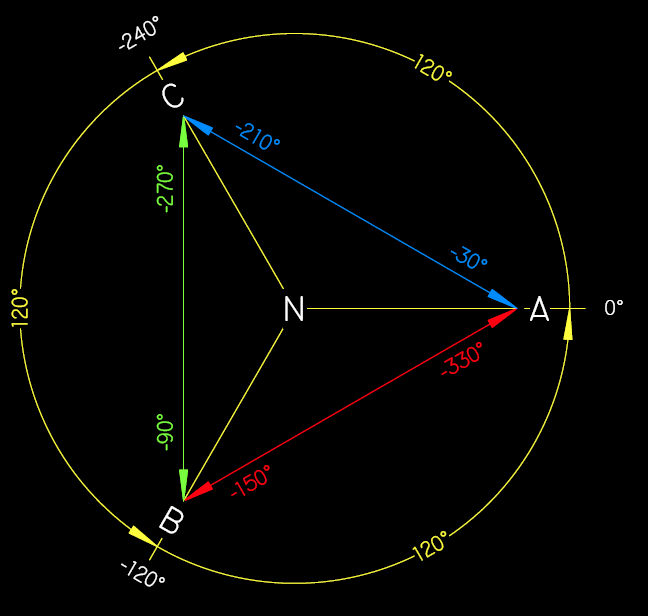
I'm having trouble seeing where you are getting your angles for the load currents which you are adding vectorally to get the line current. I know all of the vectors are the L-L currents with their respective angles but I'm not seeing where you are getting the angles. Can you please explain? From looking at it, it appears that the L-L current angles are 30deg phase shifted from normal L-N currenat at 0,120,and 240?
I think that the vector diagram here is more correct in the HYPOTHETICAL depiction of what is happening. The phase angle of adjacent phases are always 120* if each phase has the same power factor.

We do not know that is the power factor of the rectifiers, but we know it's lousy. Unless the load diagram depicts kW loads it is immaterial if we only try to look at amperes. The phase-to-phase relationship will not change on a single phase load. The large loads are the rectifiers and they are connected between two phases. Assuming that the 45kVA load is a transformer and that the loads are balanced in each phase and also assuming that the rectifiers have a 30* angle worse power factor than the transformer then the following vector diagram is applicable.
 
Thanks for the diagram. I am still waiting for the engineers answer.

I'm having trouble seeing where you are getting your angles for the load currents which you are adding vectorally to get the line current. I know all of the vectors are the L-L currents with their respective angles but I'm not seeing where you are getting the angles. Can you please explain? From looking at it, it appears that the L-L current angles are 30deg phase shifted from normal L-N currenat at 0,120,and 240?

L-L currents, for unity power factor loads, have the same angle as the applied voltage. The voltage is derived from two out-of-phase-by-120? sinusoidal waveforms, which are referenced to zero system volts (i.e. neutral of a wye supply, virtual neutral of a delta supply). The derived L-L voltages are +30? or ?30? with respect to the phase of the connected line and dependent on which line the other side of the load is connected.

angles.gif
 
We do not know that is the power factor of the rectifiers, but we know it's lousy.
Possibly so. It would depend on the type of rectifier and the characteristics of the load. If it is a phase-controlled rectifier, then it will have a poor displacement power factor, high harmonic content and less than unity distortion factor particularly at at low output voltages. Without knowing the characteristics the transformer rectifiers units and their loads it's a bit difficult to draw firm conclusions. Certainly vector diagrams are good for representing the fundamental component but not so useful for harmonics.
But I note your earlier point.
A 94kVA load seems to be rather high to connect as a single phase load particularly given that there is a three phase supply available. Maybe there is a sound basis for doing so.
Maybe Philly can shed more light on that.
 
I'm of the impression Philly is not the designer.
And nor did I think he was. But since he presented the information in the OP, it seemed not unreasonable ask him.

I'm also of the impression this is for an electrostatic precipitator
Yes, "Precipitator single line" is a just little clue. I'd even hazard a guess that it might be for a cement plant.
 
A 94kVA load seems to be rather high to connect as a single phase load particularly given that there is a three phase supply available. Maybe there is a sound basis for doing so.
Maybe Philly can shed more light on that.

Unfortunately I'm not the design engineer so I'm not sure why this 94kVA load was connected to single phase when 3-phase supply was avaliable. I always assumed it had something to do witht the fact that AC was being rectified to DC power and maybe it was more economical or efficient to do it with single phase.

This design is indeed for precipitators and are located in a cement plant. These are for a new precipitator that is being installed.

I appreciate all of the vector diagram posts and explanations. I have been busy the last 24hrs but I now am going to sit down and look at each one closely to get a better understanding of these diagrams in general and more importantly how they relate to this application.
 
You have not shifted that 0 phase rectifier.

Thank You everyone for your responses. I finally got around to studying some of these vector diagrams and I can see now what is going on and how these load and line currents should look. I can see how these vectors look with a 30deg phase shift as others have shown.

Warros I understand Smart $'s diagram but cannot seem to understand why yours is different. Can you explain your comment above.

In going through this exercise I realized that the Load and Line currents are different. So If I went and put clamp on meters on all three T1 load currents and measured their current, the total of these would not match the current measured with a single clamp on meter on the incoming T1 line. This is due to the phase angles and cannot be seen by just purley measuring current magnigudes. Is this correct?
 
You have not shifted that 0 phase rectifier.

If we are using the load transformer's current as the reference, it's L1 current would be assigned the 0? phase angle.

If the L1-L2 connected rectifier were of an equivalent power factor to the transfomer, it's current at the L1 end would be -330?... because it is a 1?, line-to-line load, whereas the transformer is a 3? load. Again, that is if the rectifier and transformer were of the same power factor.

However, the assumption was that the rectifiers had a 30? worse power factor. This would make the L1-L2 rectifier's current lag by another 30?. Therefore, the phase angle of its current would be -330? ? 30? = -360? or 0?.

My diagram shows both the transformer's and first rectifier's L1 currents at 0?. All the other rectifier's current phase angles reflect the same -30? adjustment.
 
...So If I went and put clamp on meters on all three T1 load currents and measured their current, the total of these would not match the current measured with a single clamp on meter on the incoming T1 line. This is due to the phase angles and cannot be seen by just purley measuring current magnigudes. Is this correct?

Yes, it is.
 
Warros I understand Smart $'s diagram but cannot seem to understand why yours is different. Can you explain your comment above.

I presume your comment was to me - Weress.

If you look at Smart$ drawing, observe the current phasors leaving from the center at 3 o'clock and compare it to the others at 11 and 7. the first phaser supposed to represent the transformer winding. Directly after those there is a single phase rectifier that is phase shifting in relationship to the transformer in ALL phases except in the 3 o'clock phase, therefore it is incorrect.
 
Status
Not open for further replies.
Top