francesco.ciani88
New User
- Location
- bologna
Hi all,
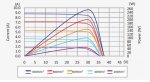
I am dealing with photovoltaic system, but I am not expert with that. I have the solar exposure in W/m^2 in a specific hour of the day and I want to translate in Volt and Ampere, but I am not sure about how I can do it. Watching the DATA-SHEET of my panel. I found the attached curves, but now I don't Know which curves I should use (1000W/m^2 , 800W/m^2 , 600W/m^2 , 400W/m^2 , 200W/m^2).
Focusing on my case, if I know that at 10:00 I have just 5 W/m^2, how can I find whic are Voltage and ampere?