gar
Senior Member
- Location
- Ann Arbor, Michigan
- Occupation
- EE
120118-0927 EST
T.M.:
How can you provide a solution when at this point in time the cause of the problem, failed components, is not known.
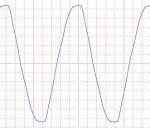
Flat topped voltage waveforms almost certainly are not the cause of electronic ballast failures.
The failure of phase shifting capacitors on induction motors also seems unlikely from a flat top voltage. These capacitors are in series with an inductor and thus a series resonant circuit. The tuning of this circuit relative to harmonics in the excitation would be of concern. We don't know what this frequency is.
I have already tried to explain to you that in the United States the part of the grid supplying the final distribution transformers has a flat top in many areas. Thus, changing the pole transformer is not going to eliminate the flat top.
.
T.M.:
How can you provide a solution when at this point in time the cause of the problem, failed components, is not known.
Flat topped voltage waveforms almost certainly are not the cause of electronic ballast failures.
The failure of phase shifting capacitors on induction motors also seems unlikely from a flat top voltage. These capacitors are in series with an inductor and thus a series resonant circuit. The tuning of this circuit relative to harmonics in the excitation would be of concern. We don't know what this frequency is.
I have already tried to explain to you that in the United States the part of the grid supplying the final distribution transformers has a flat top in many areas. Thus, changing the pole transformer is not going to eliminate the flat top.
.
")