Power factor and VA vs Watts

Status
Not open for further replies.

ggunn

PE (Electrical), NABCEP certified
Location
Austin, TX, USA
Occupation
Consulting Electrical Engineer - Photovoltaic Systems
Yes, we associate the power with the value of Pavg... But does it not stand to reason if we use Pavg, apparent, real, or reactive, then there is a waveform associated with it?
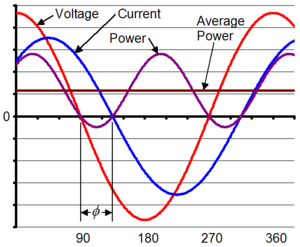
Now I'm confused. I thought that Pavg referred to power averaged over time. How can you have an instantaneous value for something averaged over time that is different for different points in time? I'm a long time out of school, but I remember (rightly or wrongly) average power and RMS values as being flat horizontal lines in the time domain.

RMS means root mean square, which is the square root of the average (mean) of the square of the AC waveform. When you square the AC waveform, it all becomes positive, when you average it, it becomes a flat line, and when you square root it, you undo the squaring you did in the first step, but you take the positive root. This results in a flat line in the time domain with a positive value in Y - voltage, current, or power.

But like I said, I'm a long time out of school and I've slept several times since then. :grin:
 
Last edited:

Besoeker

Senior Member
Location
UK
I said real power. A capacitor (not accounting for losses?an ideal capacitor) uses no real power. Pavg is zero.
Yes, Pav is zero. But the instantaneous power has positive, zero, and negative values.
To that extent your chart is incorrect. If the current is positive and the voltage is negative the power is negative. No ifs. No buts. Yet, according to both your graph it is always positive. That's not right.

The other point I take issue with is your comment:
FWIW, instantaneous power represents apparent power
Instantaneous power is power. One Watt is one Watt. Nothing apparent about it.
 

Cold Fusion

Senior Member
Location
way north
In the instantaneous domain, yes.

But in the Vrms and Irms domain, it is...

I've not heard these terms before. Exactly how are you defining them?

(apparent power)? = (real power)? + (reactive power)?
This is where i tell you it is time to get complex:roll:.

S = P + Q, where S = complex power ( or apparent power or VA), P = real power (Watts), Q = Reactive power (VARs). All three quanities are vectors, with magnitude and phase angle.

cf
 

Cold Fusion

Senior Member
Location
way north
Yes, we associate the power with the value of Pavg... But does it not stand to reason if we use Pavg, apparent, real, or reactive, then there is a waveform associated with it?
There is no waveform associated with Pavg.

(edit to add) As ggunn said, Pave is defined as an integral over 1 period. It is a magnitude, similar to Vrms, Irms. No waveforms here. These are all magnitudes - no phase angles involved.

The rms definitions were given earlier - so I won't repeat.

Pavg = (1/T) ∫v(t) i(t) dt

For sinusoidal waveforms, driving resistive loads:
Vrms X Irms = Pavg

I think that is why the industry came up with the rms concept was so this relationship was true.

Can't use Vavg and Iavg, cause those magnitudes are zero.

Yes, as you said a lot earlier, it's complex, but the terms are clearly defined.

Just an aside: RMS power is just sales/marketing hype. It has no use in our industry.

edit: Whoops missed ggunn's post>

cf
 
Last edited:

steve66

Senior Member
Location
Illinois
Occupation
Engineer
I think Smart is taking the current and dividing it into a component that is in phase with the voltage, and another component that is not in phase with the voltage. No reason we can't do this.

So if we plot the product of current and voltage that are in phase, we should see the waveform of the real power (before we calcualte any RMS values).

If we plot the product of current and voltage that are out of phase by 90 degrees, we get a plot of the reactive power.

If we plot the product of the total current and voltage, we get a plot of the apparent power.

Or, look at it this way: If we have a waveform that shows the total instantaneous power, there isn't any reason why we can't separate that into two different waveforms - one being the real power and one being the apparent power.

So I don't see any problem with plotting instantenous values.

However, I think your graph still has a few problems. I think the real power has to be in phase with the voltage (for the reason GAR talked about).

Also, I don't think the real power is a sine wave. It should be the product of current times voltage, which should be a sine squared curve (which I think looks a little different than a standard sine wave.)

Steve
 

Hameedulla-Ekhlas

Senior Member
Location
AFG
ac+power2.png


for inductor and capacitor.

619px-Power_factor_0.svg.png
 

gar

Senior Member
Location
Ann Arbor, Michigan
Occupation
EE
100413-1506 EST

Steve:

If you look at the equation I presented above for sin^2 you see the result is a cosine wave of double frequency with a DC component in the positive direction with a value of the peak of the cosine wave. Thus, in fact the modulation waveform on the DC average value is sinusodial and of double frequency.

.
 

gar

Senior Member
Location
Ann Arbor, Michigan
Occupation
EE
100413-1513 EST

Ham:

By my definition of the word power without modifiers means the rate of doing work. This is the resistive component in an electrical circuit.

Therefore, I do not agree with your curve labeled power nor your average power curve.

.
 

steve66

Senior Member
Location
Illinois
Occupation
Engineer
100413-1506 EST

Steve:

If you look at the equation I presented above for sin^2 you see the result is a cosine wave of double frequency with a DC component in the positive direction with a value of the peak of the cosine wave. Thus, in fact the modulation waveform on the DC average value is sinusodial and of double frequency.

.

That's right, it has to still be a pure sine wave because of the trig identity sin^2 x = (1-cos 2x)/2. We can even see the DC component and the double frequency in this identity.

Steve
 

ggunn

PE (Electrical), NABCEP certified
Location
Austin, TX, USA
Occupation
Consulting Electrical Engineer - Photovoltaic Systems
That's right, it has to still be a pure sine wave because of the trig identity sin^2 x = (1-cos 2x)/2. We can even see the DC component and the double frequency in this identity.

Steve
Well, yes, there's a DC component. The square of the sine cannot have any negative values.
 

Cold Fusion

Senior Member
Location
way north
I think Smart is taking the current and dividing it into a component that is in phase with the voltage, and another component that is not in phase with the voltage. ...

So if we plot the product of current and voltage that are in phase, we should see the waveform of the real power ...

If we plot the product of current and voltage that are out of phase by 90 degrees, we get a plot of the reactive power.

If we plot the product of the total current and voltage, we get a plot of the apparent power. ...

Well, you can do anything you want, but if the terms are either not industry standard, or specially defined for for this discussion, no one will know what you mean.

The concepts you are discussing are not any industry standard I am aware of. I have some ideas that I think you might have in mind - but I'm not sure.

However, I think your graph still has a few problems. I think the real power has to be in phase with the voltage (for the reason GAR talked about). ...
For the sinusoidal V, I, P we are discussing, power is never "in phase" with voltage. The frequencies are different. V and P go in-phase and out-of-phase twice per fundamental period

Also, I don't think the real power is a sine wave. It should be the product of current times voltage, which should be a sine squared curve (which I think looks a little different than a standard sine wave.) ...
delete response and add "Slow again - already discussed)

cf
 
Last edited:

steve66

Senior Member
Location
Illinois
Occupation
Engineer
100413-1506 EST

Steve:

If you look at the equation I presented above for sin^2 you see the result is a cosine wave of double frequency with a DC component in the positive direction with a value of the peak of the cosine wave. Thus, in fact the modulation waveform on the DC average value is sinusodial and of double frequency.

.

I having a hard time connecting the trig identity above with the graphs we see so often like this one:

http://www.sweethaven.com/sweethaven/ModElec/acee/lessonMain.asp?iNum=0105

It seems like the power plots shown in green must be wrong.

Steve
 

ggunn

PE (Electrical), NABCEP certified
Location
Austin, TX, USA
Occupation
Consulting Electrical Engineer - Photovoltaic Systems
I having a hard time connecting the trig identity above with the graphs we see so often like this one:

http://www.sweethaven.com/sweethaven/ModElec/acee/lessonMain.asp?iNum=0105

It seems like the power plots shown in green must be wrong.

Steve
Wrong in what way? It says specifically that voltage and current are in phase, so it's a purely resistive load. The green area is a sine squared curve. Positive times positive is positive, negative times negative is positive. What's the problem?
 

steve66

Senior Member
Location
Illinois
Occupation
Engineer
Wrong in what way? It says specifically that voltage and current are in phase, so it's a purely resistive load. The green area is a sine squared curve. Positive times positive is positive, negative times negative is positive. What's the problem?

A sine squared curve should be a cos 2x wave with a DC offset. Not the full wave rectified thing they show in green with the sharp corners at 0.

I know I'm probably just having a momentary lapse, but I can't seen to figure out how they can both be right.
 

ggunn

PE (Electrical), NABCEP certified
Location
Austin, TX, USA
Occupation
Consulting Electrical Engineer - Photovoltaic Systems
A sine squared curve should be a cos 2x wave with a DC offset. Not the full wave rectified thing they show in green with the sharp corners at 0.

I know I'm probably just having a momentary lapse, but I can't seen to figure out how they can both be right.
Well, I don't know what y=(1-cos 2x)/2 looks like off the top of my head, but if you do a point by point calculation multiplying two congruent sine waves you'll see that green curve.
 
Last edited:

Cold Fusion

Senior Member
Location
way north
A sine squared curve should be a cos 2x wave with a DC offset. Not the full wave rectified thing they show in green with the sharp corners at 0.

I know I'm probably just having a momentary lapse, but I can't seen to figure out how they can both be right.
Nope you are not having a lapse. You are exactly right. The waveform should not have sharp edges at zero. It is a sinusoid.

The website is wrong. Man that is hard to believe - something on the web is wrong. The planets may stop tonight.

Steve -
You should do the honors and sent them a note to clean up their physics.

cf
 

steve66

Senior Member
Location
Illinois
Occupation
Engineer
Well, I don't know what (1-cos 2x)/2 looks like off the top of my head, but if you do a point by point calculation multiplying two congruent sine waves you'll see that green curve.

Write it like this: 1/2 - (cos 2x)/2.

Its DC component of 1/2, with a cosine wave (double frequency - that's the 2x) with an amplitude of 1/2.

So its just a sine wave with some shifting.

Try plotting sin (x) * sin (x). It is also a sine wave with some shifting.

Neither has the sharp corners that the green graph has. The only way I see to get those is by applying some rectifier or non-linear device.

Steve
 

Hameedulla-Ekhlas

Senior Member
Location
AFG
100413-1134 EST

Turn the load into an equivalent parallel circuit, resistor plus reactive components. The only power lost is in the resistor. The current thru the resistor is in-phase with the voltage across the resistor. Therefore, the instantaneous power (real power) is of a double frequency in phase with the voltage and is represented by
sin^2 t = 1/2 - (cos 2t)/2.

Logic will tell you that a normal linear resistor can not feed power back to the source at any instant of time. Energy always flows into the resistor and out as heat. Therefore, real instantaneous power with a linear load is always positive.

.

gar,
I am completely agree with your explaination but regarding to your equation for instantaneous real power, are you sure it is like this.
I know the below equation or you may have brought some trigometery changes.


P = P + Pcos2wt......(1)

and see the graph too
 

steve66

Senior Member
Location
Illinois
Occupation
Engineer
Nope you are not having a lapse. You are exactly right. The waveform should not have sharp edges at zero. It is a sinusoid.

The website is wrong. Man that is hard to believe - something on the web is wrong. The planets may stop tonight.

Steve -
You should do the honors and sent them a note to clean up their physics.

cf

If it was only that website, I would pass it off as their being wrong :grin:

But it seems a lot of books and such show the same waveform.

I can't help but think I'm missing something.

And I've seen graphs that are somewhere between that one and a sine wave. (Sharper peaks and flatter bottoms than a sine wave - that's what got me started on this whole discussion.) But maybe that was a full wave rectified waveform.
 
Status
Not open for further replies.
Top